promethus基础
一、Prometheus概念
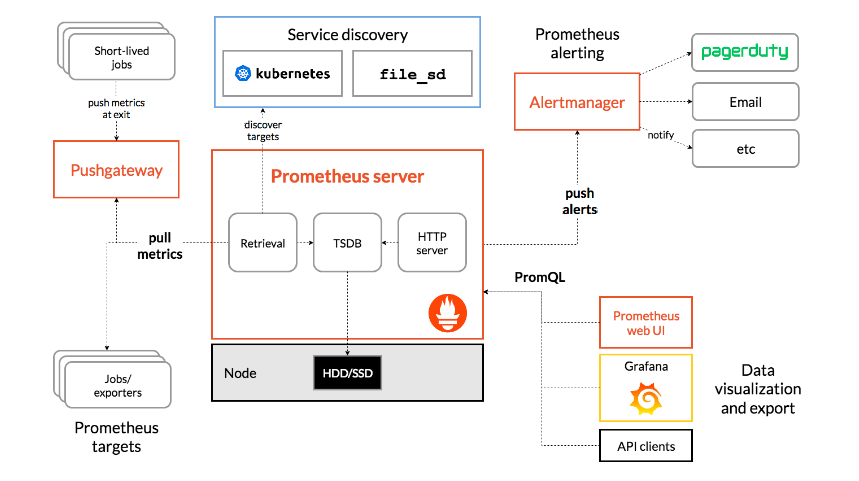
Prometheus 是一个开源的系统监控和报警系统,现在已经加入到 CNCF 基金会,成为继 k8s 之后第二 个在 CNCF 托管的项目,在 kubernetes 容器管理系统中,通常会搭配 prometheus 进行监控,同时也支持 多种 exporter 采集数据,还支持 pushgateway 进行数据上报, Prometheus 性能足够支撑上万台规模的集 群,使用go语言开发。
1.prometheus特点
Prometheus 是一个开源的监控和报警系统,具有以下几个主要特点:
多维数据模型:使用时间序列数据,配合标签(labels)进行灵活的查询和聚合。这使得用户可以对不同的维度进行监控,比如服务名称、实例、环境等。
强大的查询语言:PromQL(Prometheus Query Language)允许用户对存储的数据进行高级查询和分析,使得生成复杂的监控图表和报警条件更为直观。
拉取模型:通常使用拉取(pull)机制收集指标,Prometheus 定时从被监控的目标(如应用程序、服务等)获取数据,而不是由目标主动推送数据。
数据存储:具有高效的时间序列数据存储机制,支持本地存储和远程存储的集成。
告警功能:通过 Alertmanager 提供灵活的告警管理,支持多种通知方式(如邮件、Slack、PagerDuty 等)。
服务发现:支持多种服务发现机制(如 Kubernetes、Consul、EC2 等),能够动态发现和监控服务。
可扩展性:可以通过各种客户端库(如 Go、Java、Python 等)轻松集成到应用程序中,进行指标的采集。
图形界面:提供简单易用的界面,可以通过 Grafana 等工具进行可视化展示。
适用于云原生环境:特别适合于微服务架构和容器化环境(如 Kubernetes),能够很好地监控动态变化的服务。
2.Prometheus 组件
Prometheus Server:
- 负责从被监控的服务中抓取时间序列数据并存储。
- 提供一个强大的查询语言(PromQL)以进行数据查询和分析。
- 支持多种数据存储机制,主要为内存和磁盘。
Exporters:
- Exporters 是用来将应用程序和系统的指标转化为 Prometheus 适用格式的组件。
- 有多种现成的 Exporter,如 Node Exporter(用于监控操作系统和硬件指标)、Blackbox Exporter(用于监控外部系统的可用性)等。
- 用户也可以针对特定应用程序编写自定义 Exporter。
Push Gateway:
- 用于处理那些不能持久化在 Prometheus 服务器上的短期作业的监控数据。
- Push Gateway 接收被监控目标的指标数据,并将这些数据存储,供 Prometheus 定时抓取。
Alertmanager:
- 处理来自 Prometheus 的告警信息,可以根据设定的规则进行告警路由、抑制和聚合。
- 支持多种告警通知渠道,如 Email、Slack、PagerDuty 等。
Prometheus Query Language (PromQL):
- 强大的查询语言,允许用户对存储的时间序列数据进行复杂的查询。
- 支持多种操作,如切片、聚合、运算等,为用户提供灵活的数据分析能力。
Web UI:
- Prometheus 提供了简单的 web 界面,用户可以通过该界面查看监控数据、执行查询和配置告警。
Grafana:
- 虽然不是 Prometheus 的一部分,但 Grafana 是一个流行的可视化工具,可以与 Prometheus 集成,帮助用户创建动态仪表板,展示监控数据
3.Prometheus 工作流程
1.Prometheus server 可定期从活跃的( up)目标主机上( target)拉取监控指标数据,目标主机的监控数据可通过配置静态 job 或者服务发现的方式被 prometheus server 采集到,这种方式默认的 pull方式拉取指标;也可通过 pushgateway 把采集的数据上报到 prometheus server 中;还可通过一些组件自带的 exporter 采集相应组件的数据; 2.Prometheus server 把采集到的监控指标数据保存到本地磁盘或者数据库; 3.Prometheus 采集的监控指标数据按时间序列存储,通过配置报警规则,把触发的报警发送到alertmanager 4.Alertmanager 通过配置报警接收方,发送报警到邮件,微信或者钉钉等 5.Prometheus 自带的 web ui 界面提供 PromQL 查询语言,可查询监控数据 6.Grafana 可接入 prometheus 数据源,把监控数据以图形化形式展示出
4.Prometheus数据类型
Prometheus 提供了四种基本的数据类型,用于收集和存储监控指标。它们分别是:
- Counter(计数器)
- 定义:只增值的数值,代表某个事件的总计。计数器可以递增,但不能减少(除非重启或清除)。
- 常见应用:用于统计 HTTP 请求数、错误数、处理的任务数量等。
- Gauge(仪表值)
- 定义:可以任意增减的数值,表示某一特定时刻的值。
- 常见应用:用于监测当前温度、当前活跃用户数、内存使用量等。
- Histogram(直方图)
- 定义:用于统计分布,记录了一组数值的分布情况。可以根据预定义的桶(buckets)来计算数值的频率。
- 常见应用:测量请求延迟、响应时间等,可以获取不同延迟区间的请求数量。
- Summary(摘要)
- 定义:用于计算一组数据的统计信息,尤其是快速计算百分位(如 90th、99th 分位数)。与 Histogram 相似,但 Summary 无需预定义桶。
- 常见应用:用于监控请求延迟百分位数等。
5.prometheus能监控什么?
Prometheus 是一个强大的监控与报警系统,可以监控多种指标和应用类型。以下是一些常见的监控对象和使用场景:
- 基础设施监控
- 服务器性能:CPU 使用率、内存使用量、磁盘 I/O、网络流量等。
- 容器监控:Docker 和 Kubernetes 中运行的容器的资源使用情况。
- 应用监控
- Web 应用:HTTP 请求数、响应时间、错误率、用户活跃度等。
- 后台服务:任务处理的计数、处理时间、队列长度等。
- 数据库监控
- 数据库性能:查询响应时间、连接池使用情况、错误数、事务数等。
- 指标监控:如 MySQL、PostgreSQL、MongoDB 的性能指标。
- 网络监控
- 网络流量:进出流量、丢包率、延迟等。
- 网络服务:监控 DNS、HTTP、HTTPS 和其他网络服务的可用性和性能。
- 云服务监控
- 云环境:监控 AWS、GCP、Azure 等提供的资源使用情况和服务状态。
- 自定义指标
- 业务指标:根据具体业务需求定义并收集的指标,例如交易金额、用户注册数等。
- 告警系统
- 自定义告警:基于监控数据创建自定义告警,根据阈值触发告警,发送通知。
- 分布式系统
- 微服务监控:监控微服务架构中的服务健康状况、可用性和性能。
二、prometheus部署
prometheus是一个很大的体系,需要部署很多的插件。
1.node-exporter 组件安装和配置
node-exporter 可以采集机器(物理机、虚拟机、云主机等)的监控指标数据,能够采集到的指标包 括 CPU, 内存,磁盘,网络,文件数等信息。
由于我们是在k8s中部署,所以需要创建一个名称空间用于存放相关组件等
kubectl create ns kube-prometheus
组件的yml,vim node-export.yml
apiVersion: apps/v1
kind: DaemonSet #保证每个节点都能有完全一样的pod
metadata:
  name: node-exporter
  namespace: kube-prometheus
  labels:
    name: node-exporter
spec:
  selector:
    matchLabels:
     name: node-exporter
  template:
    metadata:
      labels:
        name: node-exporter
    spec:
    # hostNetwork、 hostIPC、 hostPID 都为 True 时,表示这个 Pod 里的所有容器,会直接使用宿主机的网络,直接与宿主机进行 IPC(进程间通信) 通信, 可以看到宿主机里正在运行的所有进程。加入了 hostNetwork:true 会直接将我们的宿主机的 9100 端口映射出来,从而不需要创建 service 在我们的宿主机上就会有一个 9100 的端口
      hostPID: true
      hostIPC: true
      hostNetwork: true
      containers:
      - name: node-exporter
        image: prom/node-exporter:v0.16.0
        ports:
        - containerPort: 9100
        resources:
          requests:
            cpu: 0.15
        securityContext:
          privileged: true #打开特权模式,这样容器才能有资源
        args: #配置需要加载的目录
        - --path.procfs
        - /host/proc
        - --path.sysfs
        - /host/sys
        - --collector.filesystem.ignored-mount-points
        - '"^/(sys|proc|dev|host|etc)($|/)"'
        volumeMounts:
        - name: dev
          mountPath: /host/dev
        - name: proc
          mountPath: /host/proc
        - name: sys
          mountPath: /host/sys
        - name: rootfs
          mountPath: /rootfs
      tolerations: #容忍度,主要是要让master节点运行
      - key: "node-role.kubernetes.io/master"
        operator: "Exists"
        effect: "NoSchedule"
      volumes: #去获取物理机的信息
        - name: proc
          hostPath:
            path: /proc
        - name: dev
          hostPath:
            path: /dev
        - name: sys
          hostPath:
            path: /sys
        - name: rootfs
          hostPath:
            path: /
#运行
kubectl apply -f node-export.yml
测试采集数据
curl http://ip:9100/metrics
#主机 cpu 的使用情况
curl http://ip:9100/metrics| grep node_cpu_seconds
2.Prometheus server 安装和配置
1.创建 sa 账号
创建 sa 账号, 对 sa 做 rbac 授权 ,因为我们需要很大的权限去采集数据,我们部署在k8s的pod中,运行在容器里所以需要做个最大的授权
#创建一个 sa 账号 monitor
kubectl create serviceaccount monitor -n kube-prometheus
#把 sa 账号 monitor 通过 clusterrolebing 绑定到 clusterrole 上
kubectl create clusterrolebinding monitor-clusterrolebinding -n kube-prometheus --clusterrole=cluster-admin --serviceaccount=kube-prometheus:monitor
2.创建 prometheus 数据存储目录
#在工作节点创建
mkdir /opt/data
chmod 777  /opt/data
3.安装 Prometheus server 服务
创建一个 configmap 存储卷,用来存放 prometheus 配置信息
#vim prometheus-cfg.yml
apiVersion: v1
kind: ConfigMap
metadata:
  labels:
    app: prometheus
  name: prometheus-config
  namespace: kube-prometheus
data:
  prometheus.yml: |
    global:
      scrape_interval: 15s #采集目标主机监控据的时间间隔
      scrape_timeout: 10s # 数据采集超时时间, 默认 10s
      evaluation_interval: 1m #触发告警检测的时间,默认是 1m
    scrape_configs: #配置数据源,称为 target每个target用job_name命名,又分为静态配置和服务发现
    - job_name: 'kubernetes-node'
      kubernetes_sd_configs:
      - role: node
      relabel_configs:
      - source_labels: [__address__]
        regex: '(.*):10250'
        replacement: '${1}:9100'
        target_label: __address__
        action: replace
      - action: labelmap
        regex: __meta_kubernetes_node_label_(.+)
    - job_name: 'kubernetes-node-cadvisor'
      kubernetes_sd_configs:
      - role:  node
      scheme: https
      tls_config:
        ca_file: /var/run/secrets/kubernetes.io/serviceaccount/ca.crt
      bearer_token_file: /var/run/secrets/kubernetes.io/serviceaccount/token
      relabel_configs:
      - action: labelmap
        regex: __meta_kubernetes_node_label_(.+)
      - target_label: __address__
        replacement: kubernetes.default.svc:443
      - source_labels: [__meta_kubernetes_node_name]
        regex: (.+)
        target_label: __metrics_path__
        replacement: /api/v1/nodes/${1}/proxy/metrics/cadvisor
    - job_name: 'kubernetes-apiserver'
      kubernetes_sd_configs:
      - role: endpoints
      scheme: https
      tls_config:
        ca_file: /var/run/secrets/kubernetes.io/serviceaccount/ca.crt
      bearer_token_file: /var/run/secrets/kubernetes.io/serviceaccount/token
      relabel_configs:
      - source_labels: [__meta_kubernetes_namespace, __meta_kubernetes_service_name, __meta_kubernetes_endpoint_port_name]
        action: keep
        regex: default;kubernetes;https
    - job_name: 'kubernetes-service-endpoints'
      kubernetes_sd_configs:
      - role: endpoints
      relabel_configs:
      - source_labels: [__meta_kubernetes_service_annotation_prometheus_io_scrape]
        action: keep
        regex: true
      - source_labels: [__meta_kubernetes_service_annotation_prometheus_io_scheme]
        action: replace
        target_label: __scheme__
        regex: (https?)
      - source_labels: [__meta_kubernetes_service_annotation_prometheus_io_path]
        action: replace
        target_label: __metrics_path__
        regex: (.+)
      - source_labels: [__address__, __meta_kubernetes_service_annotation_prometheus_io_port]
        action: replace
        target_label: __address__
        regex: ([^:]+)(?::\d+)?;(\d+)
        replacement: $1:$2
      - action: labelmap
        regex: __meta_kubernetes_service_label_(.+)
      - source_labels: [__meta_kubernetes_namespace]
        action: replace
        target_label: kubernetes_namespace
      - source_labels: [__meta_kubernetes_service_name]
        action: replace
        target_label: kubernetes_name
#运行
kubectl apply -f prometheus-cfg.yml
4.deployment 部署 prometheus
#vim prometheus-deploy.yml
apiVersion: apps/v1
kind: Deployment
metadata:
  name: prometheus-server
  namespace: kube-prometheus
  labels:
    app: prometheus
spec:
  replicas: 1
  selector:
    matchLabels:
      app: prometheus
      component: server
    #matchExpressions:
    #- {key: app, operator: In, values: [prometheus]}
    #- {key: component, operator: In, values: [server]}
  template:
    metadata:
      labels:
        app: prometheus
        component: server
      annotations:
        prometheus.io/scrape: 'false'
    spec:
      nodeName: k8s-node1
      serviceAccountName: monitor
      containers:
      - name: prometheus
        image: prom/prometheus:v2.2.1
        imagePullPolicy: IfNotPresent
        command:
          - prometheus
          - --config.file=/etc/prometheus/prometheus.yml
          - --storage.tsdb.path=/prometheus
          - --storage.tsdb.retention=720h
          - --web.enable-lifecycle
        ports:
        - containerPort: 9090
          protocol: TCP
        volumeMounts:
        - mountPath: /etc/prometheus/prometheus.yml
          name: prometheus-config
          subPath: prometheus.yml
        - mountPath: /prometheus/
          name: prometheus-storage-volume
      volumes:
        - name: prometheus-config
          configMap:
            name: prometheus-config
            items:
              - key: prometheus.yml
                path: prometheus.yml
                mode: 0644
        - name: prometheus-storage-volume
          hostPath:
           path: /opt/data
           type: Directory
#执行
kubectl apply -f prometheus-deploy.yml
5.prometheus pod 创建一个 service
#vim prometheus-svc.yml
apiVersion: v1
kind: Service
metadata:
  name: prometheus
  namespace: kube-prometheus
  labels:
    app: prometheus
spec:
  type: NodePort
  ports:
    - port: 9090
      targetPort: 9090
      protocol: TCP
  selector:
    app: prometheus
    component: server
#执行
kubectl apply -f prometheus-svc.yml
访问
http://ip:port
3.Grafana安装和配置
Grafana 是一个跨平台的开源的度量分析和可视化工具,可以将采集的数据可视化的展示,并及时通知给告警接收方。 它主要有以下六大特点:
- 多数据源支持: Grafana 支持多种数据源,包括 Prometheus、InfluxDB、Elasticsearch、MySQL、PostgreSQL 等,用户可以轻松连接和查询不同类型的数据。
- 交互式仪表板: Grafana 提供强大的仪表板创建功能,用户可以自定义面板,进行拖放操作,创建符合需求的可视化视图。同时,支持多种图表类型,如折线图、仪表盘、表格等。
- 实时监控: Grafana 可以实时更新数据,并提供实时监控的能力。用户能够设置自动刷新间隔,以获取最新的监控数据。
- 丰富的插件生态: Grafana 拥有丰富的插件(如数据源插件、面板插件等),用户可以根据需求扩展功能,实现定制化的监控和可视化需求。
- 用户管理与权限控制: Grafana 提供多用户管理功能,支持创建用户、分组、设置权限,确保不同用户可以访问合适的数据和仪表板,提高数据安全性。
- 告警功能: Grafana 允许用户设置告警规则,并通过电子邮件、Slack、Webhook 等方式发送通知,帮助用户及时响应系统异常或关键指标变化。
安装 Grafana
#vim grafana.yml
apiVersion: apps/v1
kind: Deployment
metadata:
  name: monitoring-grafana
  namespace: kube-system
spec:
  replicas: 1
  selector:
    matchLabels:
      task: monitoring
      k8s-app: grafana
  template:
    metadata:
      labels:
        task: monitoring
        k8s-app: grafana
    spec:
      containers:
      - name: grafana
        image: k8s.gcr.io/heapster-grafana-amd64:v5.0.4
        ports:
        - containerPort: 3000
          protocol: TCP
        volumeMounts:
        - mountPath: /etc/ssl/certs
          name: ca-certificates
          readOnly: true
        - mountPath: /var
          name: grafana-storage
        env:
        - name: INFLUXDB_HOST
          value: monitoring-influxdb
        - name: GF_SERVER_HTTP_PORT
          value: "3000"
          # The following env variables are required to make Grafana accessible via
          # the kubernetes api-server proxy. On production clusters, we recommend
          # removing these env variables, setup auth for grafana, and expose the grafana
          # service using a LoadBalancer or a public IP.
        - name: GF_AUTH_BASIC_ENABLED
          value: "false"
        - name: GF_AUTH_ANONYMOUS_ENABLED
          value: "true"
        - name: GF_AUTH_ANONYMOUS_ORG_ROLE
          value: Admin
        - name: GF_SERVER_ROOT_URL
          # If you're only using the API Server proxy, set this value instead:
          # value: /api/v1/namespaces/kube-system/services/monitoring-grafana/proxy
          value: /
      volumes:
      - name: ca-certificates
        hostPath:
          path: /etc/ssl/certs
      - name: grafana-storage
        emptyDir: {}
---
apiVersion: v1
kind: Service
metadata:
  labels:
    # For use as a Cluster add-on (https://github.com/kubernetes/kubernetes/tree/master/cluster/addons)
    # If you are NOT using this as an addon, you should comment out this line.
    kubernetes.io/cluster-service: 'true'
    kubernetes.io/name: monitoring-grafana
  name: monitoring-grafana
  namespace: kube-system
spec:
  # In a production setup, we recommend accessing Grafana through an external Loadbalancer
  # or through a public IP.
  # type: LoadBalancer
  # You could also use NodePort to expose the service at a randomly-generated port
  # type: NodePort
  ports:
  - port: 80
    targetPort: 3000
  selector:
    k8s-app: grafana
  type: NodePort
#执行
kubectl apply -f grafana.yml
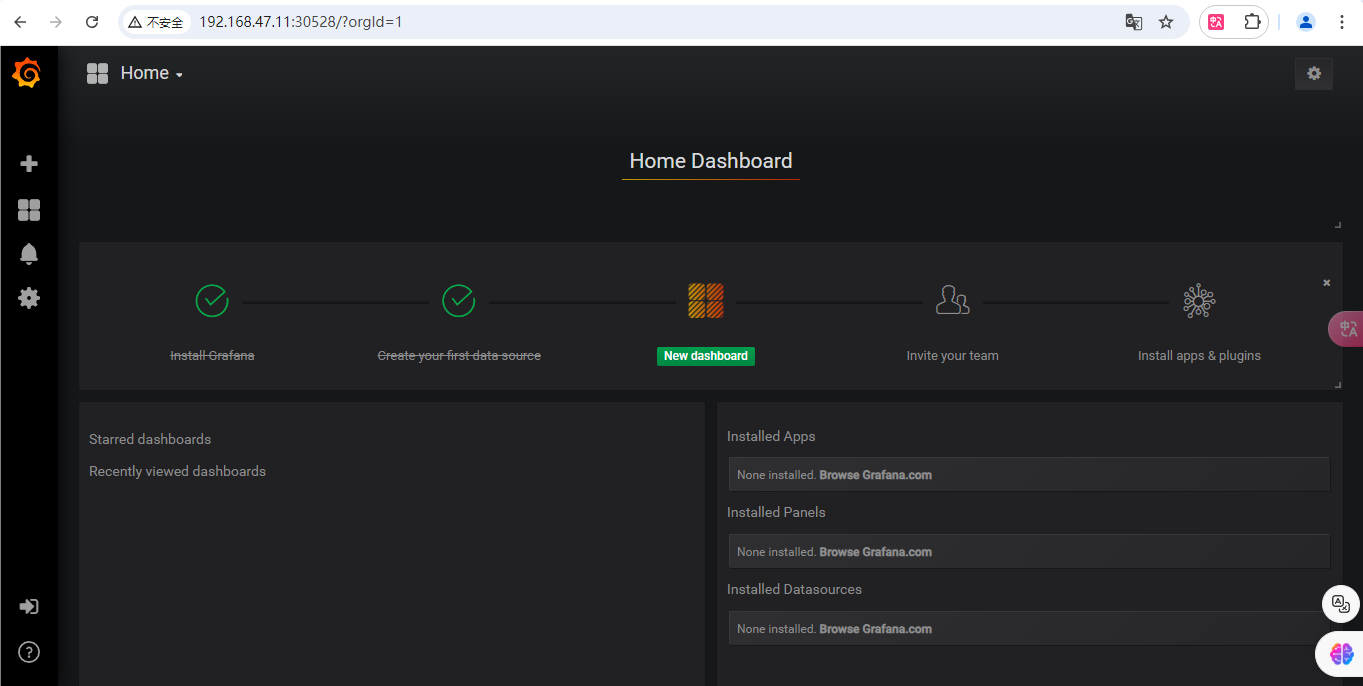
访问
http://ip:port
配置
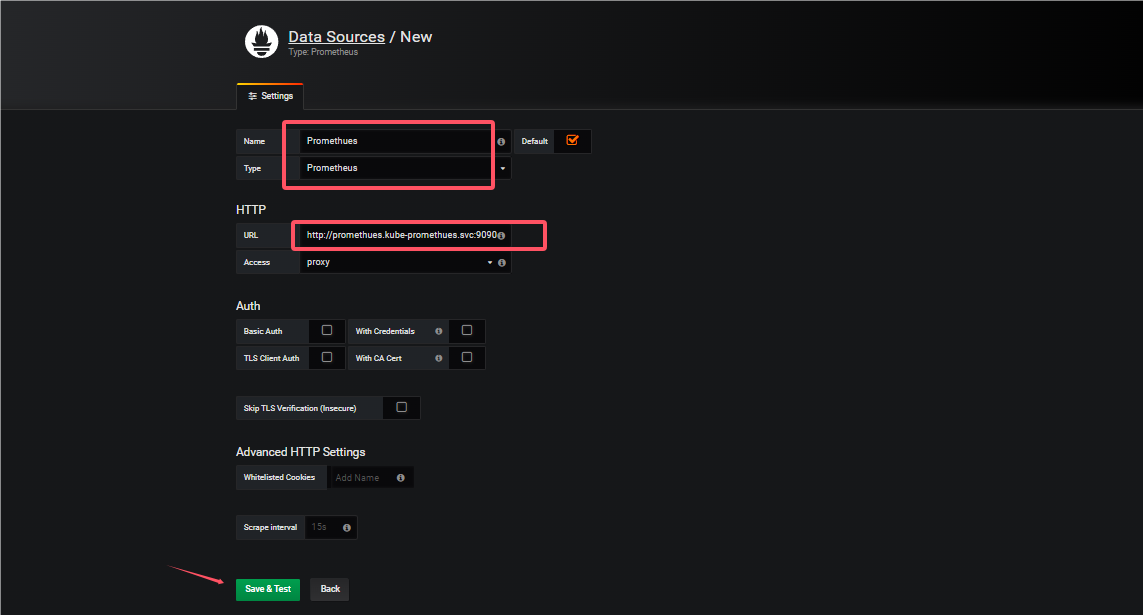
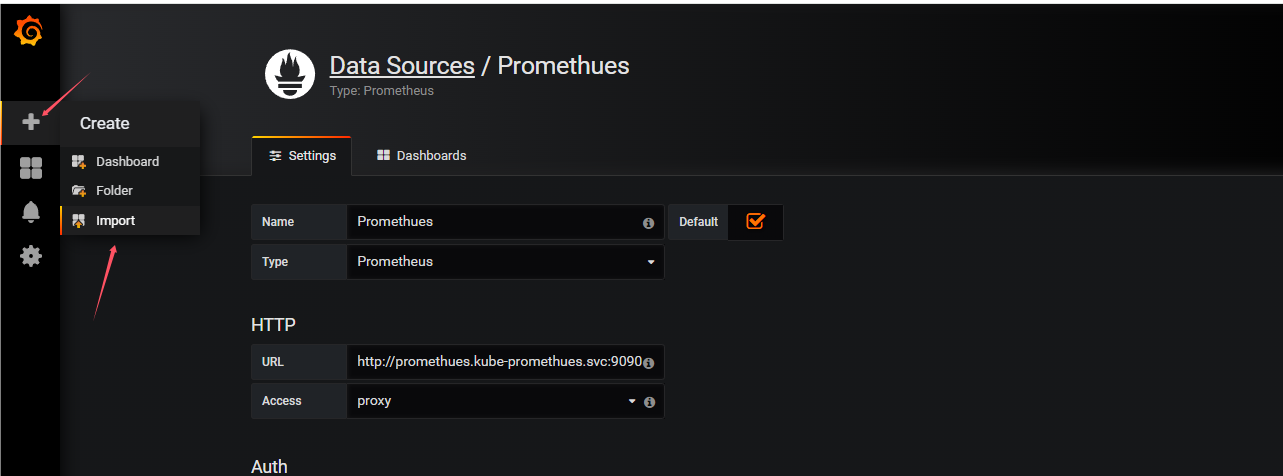
1.创建数据源
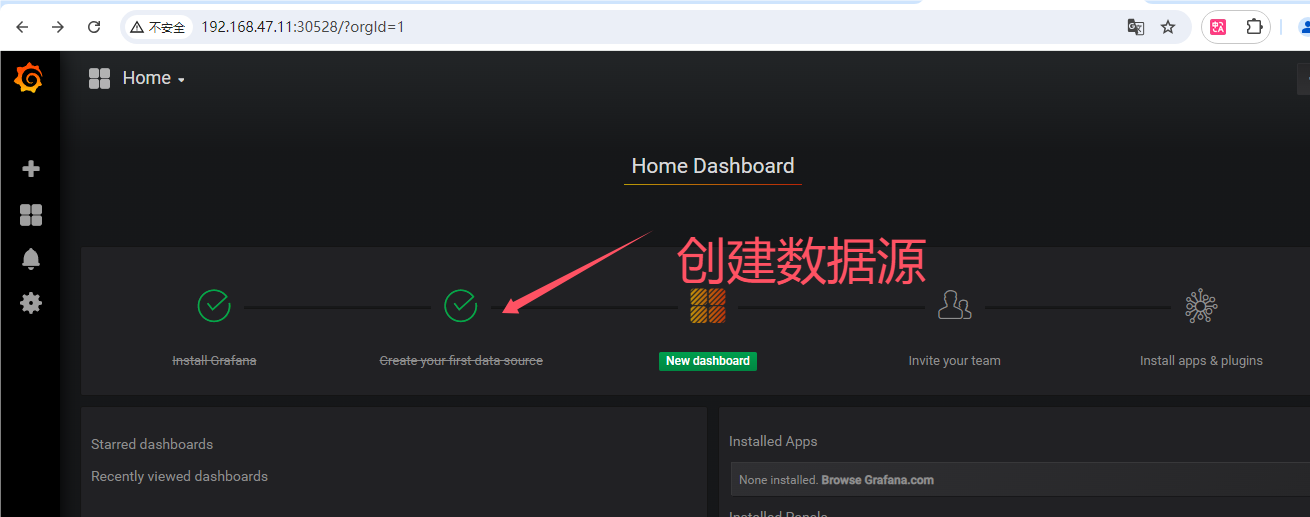
填写相应配置
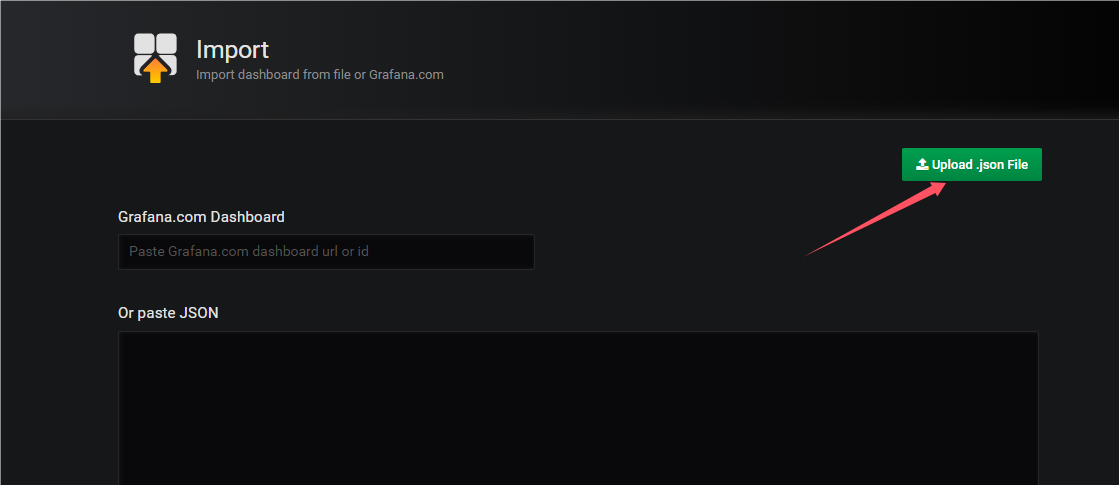
导入监控模板
#下载地址
https://grafana.com/dashboards?dataSource=prometheus&search=kubernetes
点击左侧+号下面的 Import
点击上传下载的json模板
导入
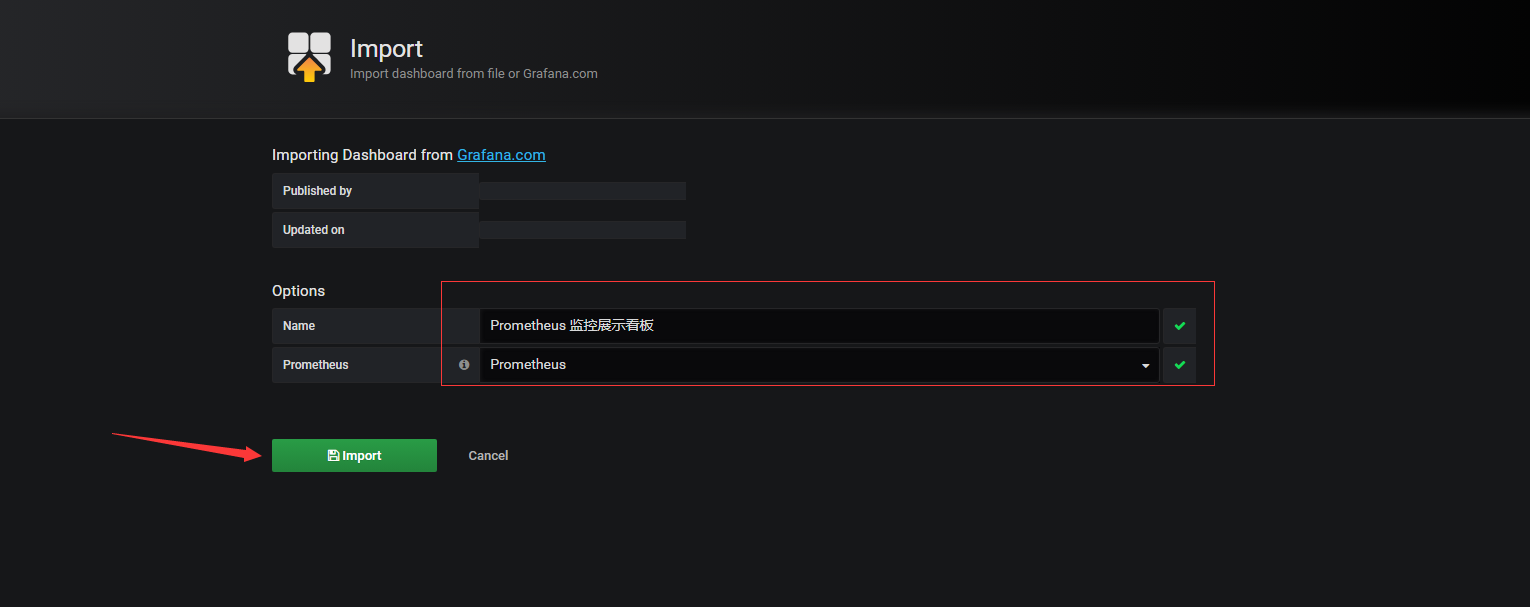
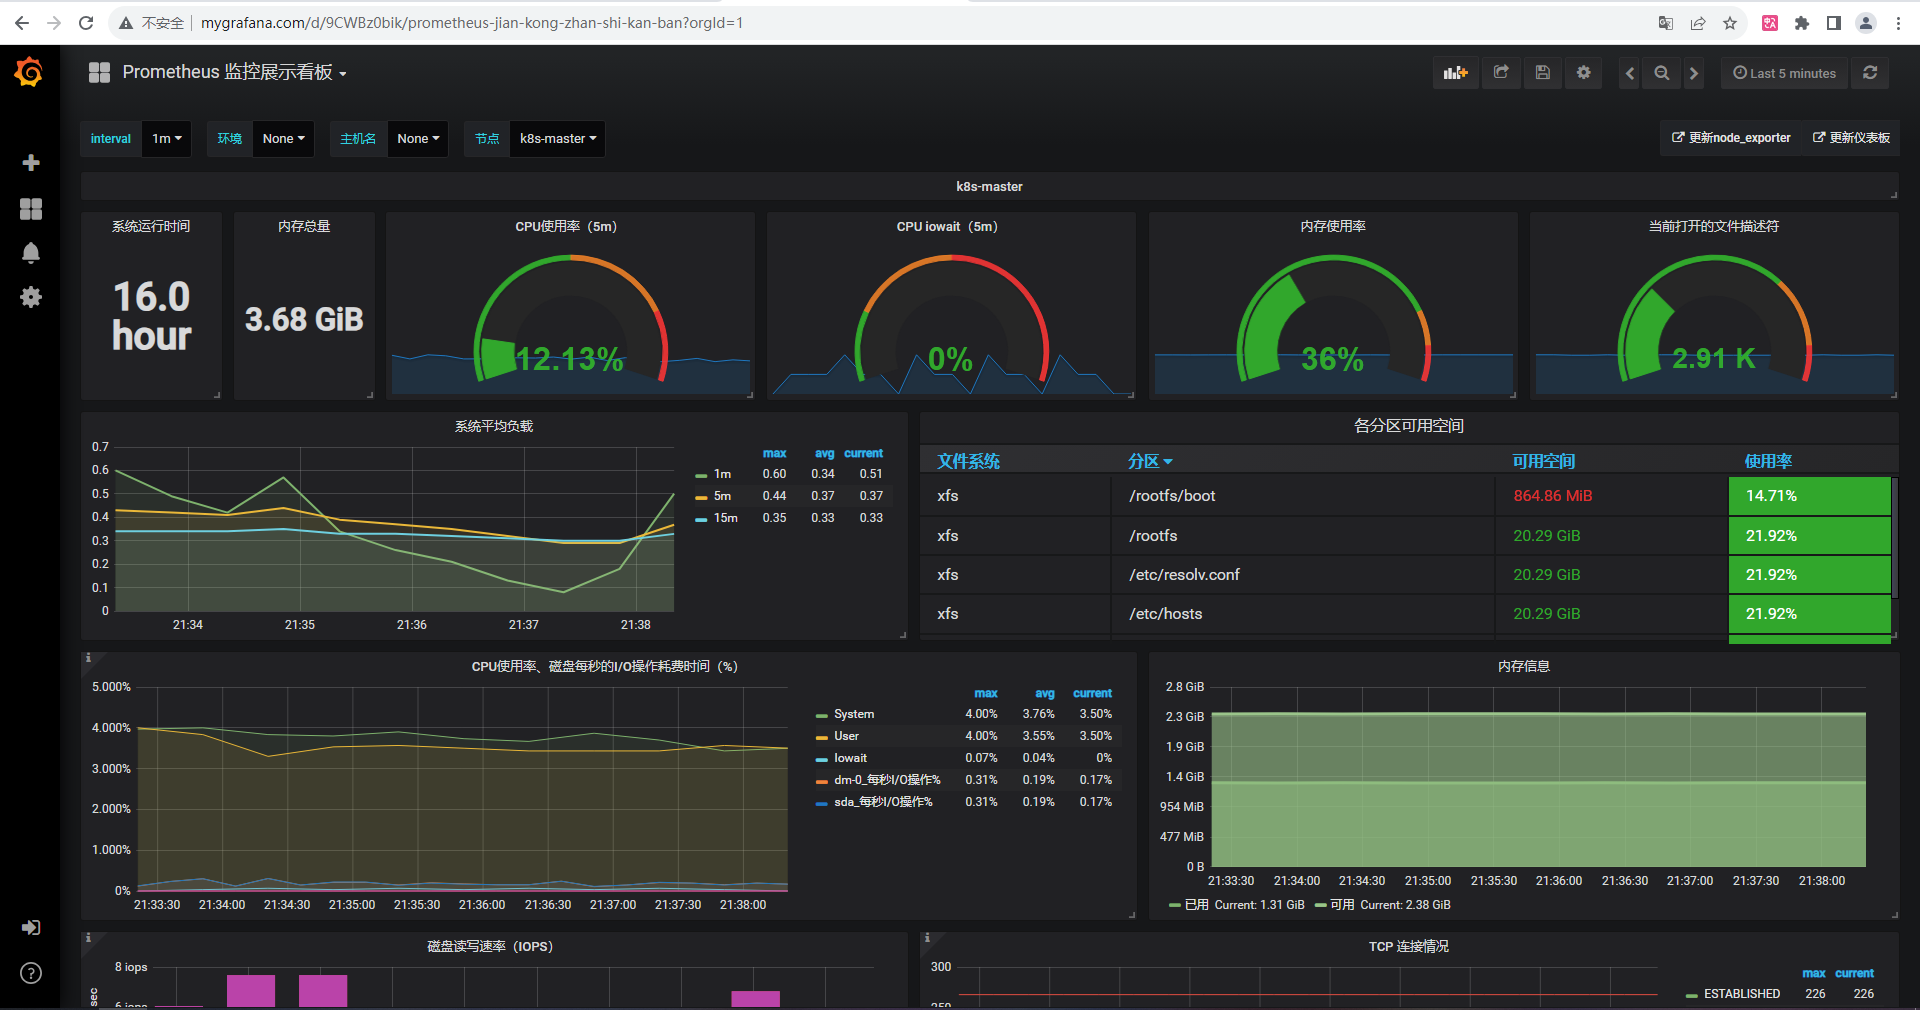
完成后出现以下页面
创建ingress-nginx
#vim grafana-ingress.yml
apiVersion: networking.k8s.io/v1
kind: Ingress
metadata:
  name: grafana-ingress #自定义ingress名称
  namespace: kube-system
  annotations:
    ingressclass.kubernetes.io/is-default-class: "true"
    kubernetes.io/ingress.class: nginx #指定控制器的类别为nginx
spec:
  rules: #定义主机列表
    - host: www.mygrafana.com #自定义域名
      http:
        paths:
          - pathType: Prefix #路径类型
            path: "/" #定义站点路径
            backend: #定义后端引用的服务
              service: #关联service
                name: monitoring-grafana #对应上面创建的service名称
                port:
                  number: 80 #service端口
三、prometheus传统部署
1.prometheus安装
1.下载普罗米修斯上传并解压
prometheus-2.27.1.linux-amd64.tar.gz
#解压
tar -zxvf prometheus-2.27.1.linux-amd64.tar.gz
#解压后移动到/usr/local/prometheus
mv prometheus-2.27.1.linux-amd64 /usr/local/prometheus
#切换到/usr/local/prometheus
cd /usr/local/prometheus
2.启动
#直接使用默认配置文件启动
./prometheus --config.file="prometheus.yml"
3.prometheus界面
ip:9090
2.node_exporter安装
1.下载客户端上传并解压
#node_exporter是被控端客户端
node_exporter-1.1.2.linux-amd64.tar.gz
#解压
tar -zxvf node_exporter-1.1.2.linux-amd64.tar.gz
#移动到/usr/local/node_exportter
mv node_exporter-1.1.2.linux-amd64 /usr/local/node_exportter
#切换到/usr/local/node_exportter
cd /usr/local/node_exportter
2.启动
nohup ./node_exporter &
3.浏览器访问
ip:9100/metrics
3.将客户端添加进监控
1.编辑配置文件
#在主配置文件最后加上下面三行
vim prometheus.yml
- job_name: 'agent1' #取一个job名称来代表被监控的机器
    static_configs:
    - targets: ['ip:9100'] # 这里改成被监控机器的IP,后面端口接9100
2.杀死所有prometheus进程
pkill prometheus
3.启动
nohup ./prometheus --config.file="prometheus.yml" &
4.监控mysql
在主配置文件最后加上下面三行
#mysql
  - job_name: 'local_mysql'
    static_configs:
    - targets: ['ip:3306']
4.grafana安装
Grafana是一个开源的度量分析和可视化工具,可以通过将采集的数据分析,查询,然后进行可视化的展示,并能实现报警
1.下载
#下载地址
https://grafana.com/grafana/download
wget https://dl.grafana.com/enterprise/release/grafana-enterprise-9.1.5-1.x86_64.rpm
2.安装
yum -y install grafana-enterprise-9.1.5-1.x86_64.rpm
3.启动服务
systemctl start grafana-server
systemctl enable grafana-server
#查看端口
netstat -anp|grep 3000
4.浏览器访问
ip:3000
默认的admin用户,admin密码